
Here’s how we transformed a complex financial data set into a fast, responsive, accessible graph that helps users make the next smart move with their finances.
Innerworks is coming soon...
This blog was originally published on our previous Cogworks blog page. The Cogworks Blog is in the process of evolving into Innerworks, our new community-driven tech blog. With Innerworks, we aim to provide a space for collaboration, knowledge-sharing, and connection within the wider tech community. Watch this space for Innerworks updates, but don't worry - you'll still be able to access content from the original Cogworks Blog if you want.
Data visualisation today.
Research has shown that 65% of us learn visually, meaning we'd rather read a high-quality infographic full of pretty colours than reams of pointless text.
Data visualisations like graphs, infographics, and interactive animations take advantage of our natural preference to learn visually, helping to uncover patterns, connections, and insights, ultimately driving brand credibility and better business decisions.
Building a powerful and positive data visualisation.
Following Bestinvest's website launch, we asked Cogworks developer Ahmed to walk us through the build of the Grow My Money tool, an animated chart designed to help users make informed decisions about their wealth!
Try Grow My Money for yourself.
See how your money could grow.
The Grow My Money tool is a super-slick way of showing you the expected outcome of certain investments over a specific period.
This sleek UI was generated through collaboration and built to merge with a complex set of data in the form of calculations that work out the financial figure that a user starts and ends with and estimates to work out the expected risk factor and its associated values.
The task.
To accompany a similar feature on the logged-in part of their website, Bestinvest asked Cogworks to deliver a tool that works seamlessly with their existing charting libraries.
We re-engineered the Grow My Money tool using their requirements as a polished component with exceptional user experience.
The technical stuff.
The Grow my Money tool is powered by Javascript, ReactJS, and Styled components (CSS in JS); it uses TypeScript, making the device high-quality, scalable and a dream to debug and test!
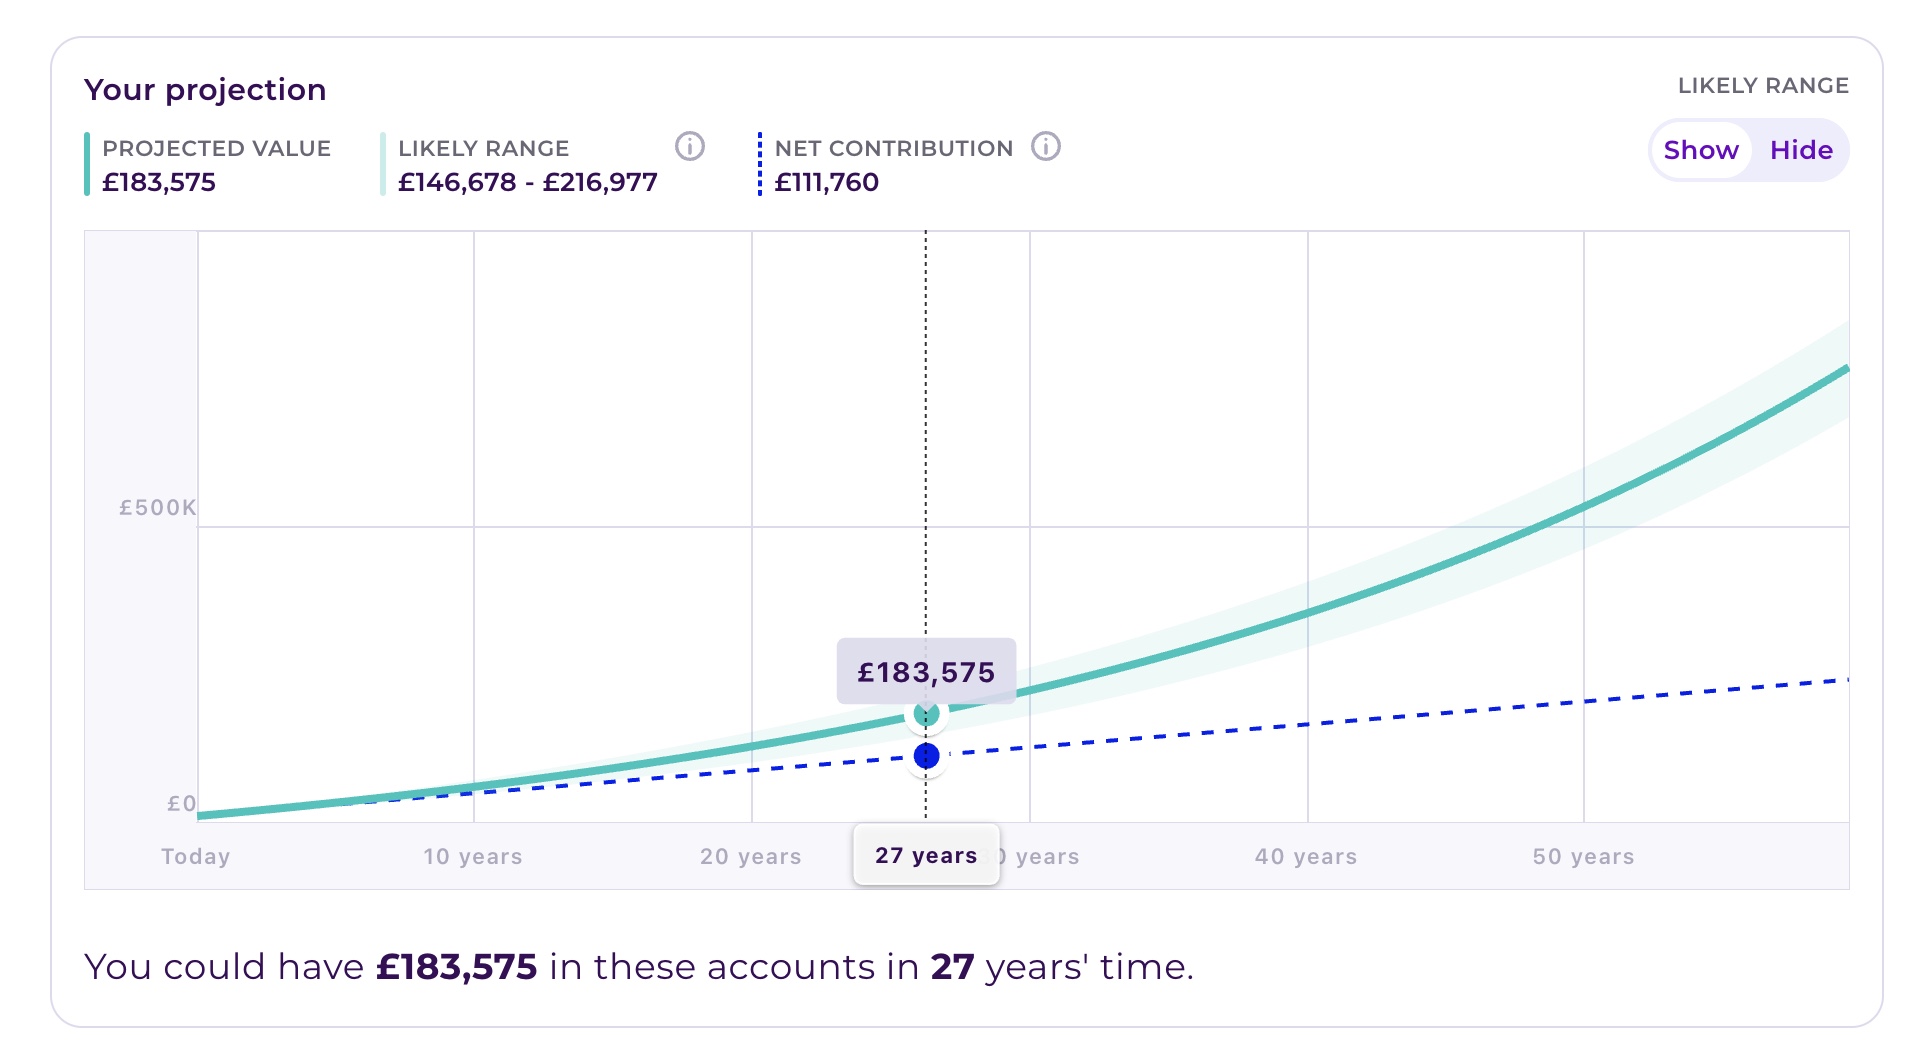
Source: Bestinvest, built by Cogworks.
If you're the technical type with great attention to detail, you'll notice the smooth UI of the graphing tool's responsive code to create precise units of measurement.
The animation of the tool is powered by features offered by the charting library out-of-the-box.
During the build, our development team researched and trialled the best way to integrate Bestinvest's chosen chart library with the tool, putting their custom logic skills to the test.
The results.
The result is a responsive tool with a smooth user interface that uses BestInvest's technology (with no compromise on performance). Plus, it has excellent usability on touchscreen and mobile devices, which is no easy feat with complex charting libraries!
Need to make a complex set of data look good?
Chat with us today and discover how Data Visualisation could work for your users!